How you can publish your data
You remember our little research project “CABS“, we were looking at its data in the last newsletter? The researches have finished the study and published the results in a medical journal. But what about the data itself? The data can be as important and relevant to the study as the results are.
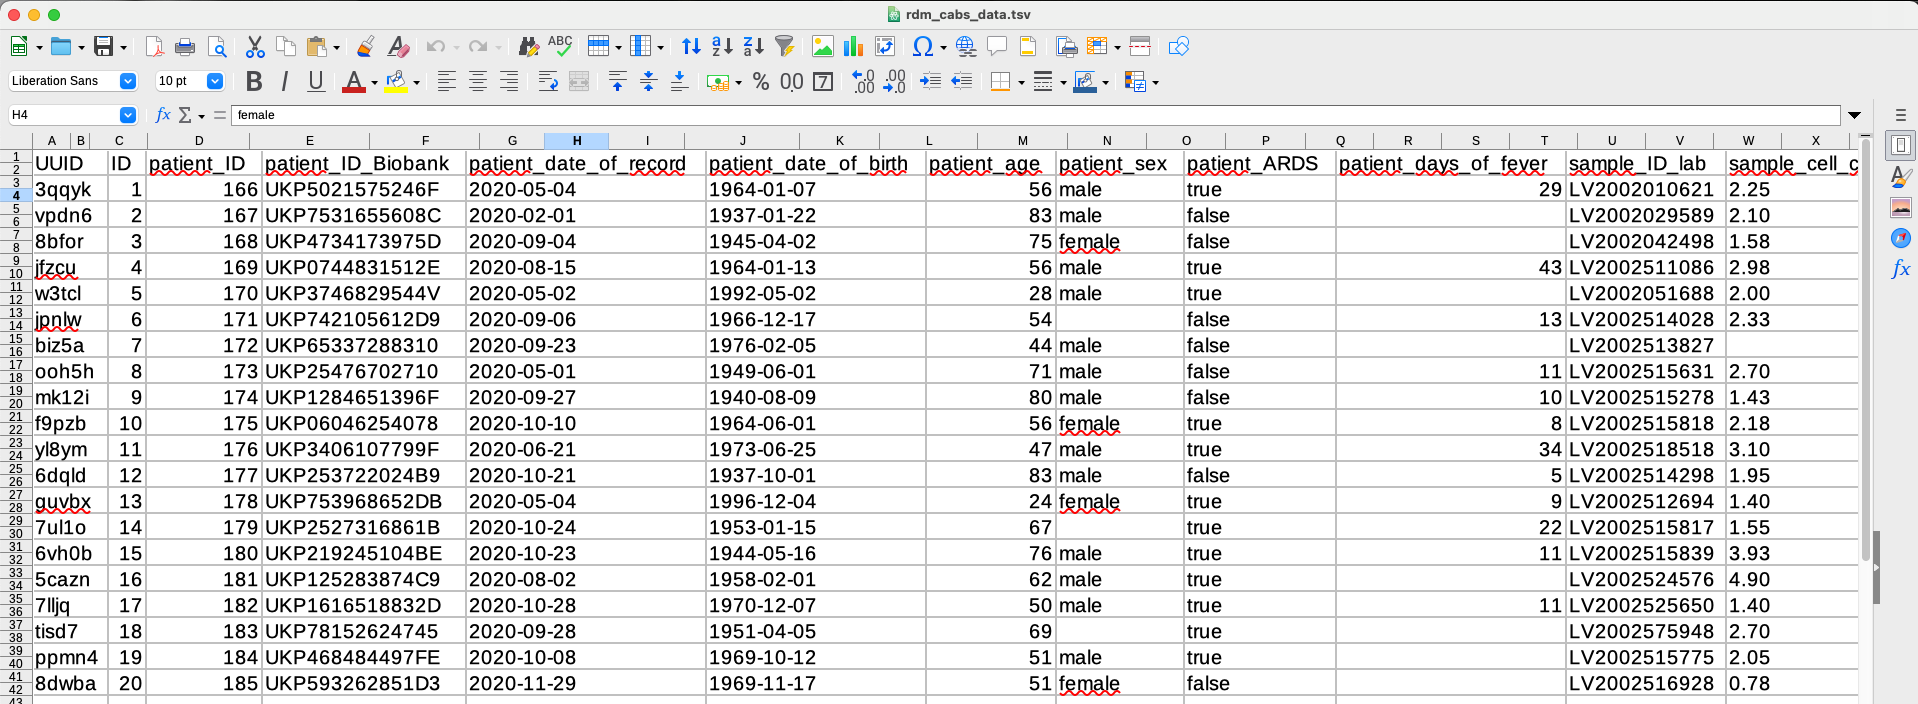
In the article the researches refer to various decisions they made in analysing the results and published three images within the article. One way could be to publish the data as supplment .tbv-file (tab-separated-value) and the images as e.g. .png-files:


But what is the benefit? The images are the same as those in the published article. However it is nice to have the data sets available in a separate file but we could and should go one step further.
Data literacy
In this newsletter I will show a way to publish your data in a most efficient way. It will lead to great transparency in the methods and algorithms used and enable everyone to actively use the data on the fly for modified calculations or when amending data.
You can read in the fantastic article “The Scientific Paper is Obsolete” about all the reasons and historical approaches to this form of scientific transparency and why this should be a common goal.
Jupyter Notebook
Jupyter Notebooks are getting more and more popular throughout all sorts of academic areas. It is a tool where you have your data, the analysis and the results all together – in a file which has a standardised format and can be accessed without using any paid licence model.
The RWTH Aachen University offers a service where you can have Jupyter Notebooks for all your researches: https://jupyter.rwth-aachen.de
What you see below is the Jupyter Notebook which contains all the data from the CABS project, the analysis methods and the results.
In the cells you insert the (Python/R) code and you get the results right below. But no worries, we will go through the notebook in detail and the videos will help to understand the benefit of such an enhanced data publication.
Functionality of Jupyter Notebook
- cells with text (markdown), and
- cells with code (Python/R).
In text cells you can give a description of the following cells and explain the methodological steps of your research.
In code cells you actually write the code as you would in any other programm/editor. When you execute the cell the code is executed directly and you see the results below.
I will give you some explanations with the follwosing examples.
Load data seta
First we look at how to import and load the data itself which is stored in a tab separated file.
Read data seta
Ok, so now we have the data imported into the JupyterNotebook. So next we will take a look at the data itself.
With few lines of codes we can take a look at the metadata of the data and get a first peak at the data.
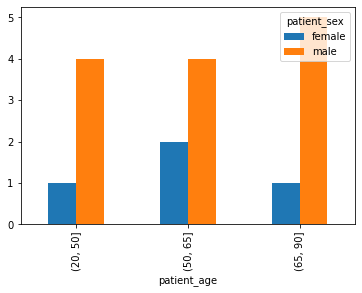
Create figures
As said before, it is easy to create images from within the JuypterNotebook. The process of how an image has been created is transparent and can be followed directly in the code.
Remodel figures
Now imagine you have published your data as such a JupyterNotebook. Your readers do not disagree with the bar plot you made, but are curious what happens when the amount of groups are changed.
Your readers can easily do so and change the parameters directly in the JupyterNotebook to get a different result.
Final thoughts
Now you have seen how data publication can be done. There is more to it than simply save a Excel-file somewhere.
If the data you gathered can be analysed and evaluated using a JupyterNotebook (or let’s say Python or R) a publication of this JupyterNotebook would be great.
Coming back to the FAIR-principles, with using JupyterNotebook your data is then accessible, interoperable and reusable. Depending where you store the JupyterNotebook (e.g. along with your text publication in RWTHpublication) it is also findable.
Meeting all criteria of FAIR should be a common goal to achieve.